
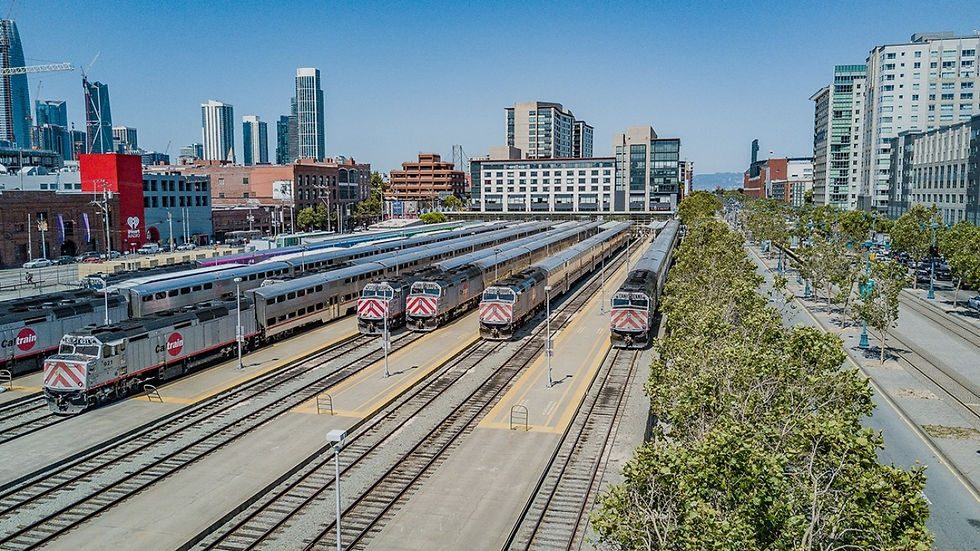
Caltrain Commuter Data Study
PROJECT CONTEXT
The Caltrain ridership analysis focuses on understanding and enhancing the commuter rail service for Caltrain, particularly around the California Avenue Station in the San Francisco Peninsula and Santa Clara Valley. The goal is to dissect ridership patterns and socioeconomic characteristics to propose infrastructural and service improvements, and to provide insights that could enhance Caltrain’s service efficiency and commuter satisfaction.

1.176B sqft*
Land Area

399k*
Population

Residential*
Primary Land Use
*data reported as of Fall 2021

TRANSIT INFASTRUCTURE

-
There are services from two major transit agencies within the 4-mile radius. Developing a coordinated schedule can improve connectivity and reduce wait time for the riders.
-
Explore new service opportunities with the connecting transit agencies, such as providing shuttle services to connect riders to nearby destinations.
Streets & Bike Infrastructure

-
Analyze the number of bike racks being utilized at the station and provide additional ones if the existing bike racks are at full capacity during peak hours.
-
Partner with local businesses to improve street infrastructure, such as funding sidewalk repairs or adding street furniture.
COMMUTERS DATA
Replica's data was used to produce visualizations in Power BI, and analyze ridership patterns among residents targeting a 4-mile radius around the station.
-
The primary mode of commute to the California Avenue Station buffer area is by private transportation.
-
78.83% of commuters who arrive in the area travel by private automobiles, while only 1.06% of commuters travel by public transit.
Arrivals by Mode & Time

-
Number of arrivals within the California Ave Station 4-mile radius peaks at 3:45pm and 7:45pm.
-
Consider increasing the frequency of service during these peak hours to accommodate the demand for ridership. This can encourage more commuters to take the train.
-
Predicting the peak hours also allows the agency to schedule routine inspections and track maintenance.
COMMUTER RAIL TRIPS
Below is a visual data analysis of commuter rail trips through the California Avenue Station, comparing the patterns from Fall 2019 (pre-pandemic) to Fall 2021 (during the pandemic).


Fall 2019 Pre-Pandemic
- The density and distribution of these dots indicate high activity and commuter flow through the corridor, with a notable concentration around major urban centers like San Francisco and San Jose.
- The pattern shows a heavy utilization of the Caltrain service before the pandemic, emphasizing frequent commutes between these major hubs.

Fall 2021 Post-Pandemic
- This map shows the same geographical area during the pandemic but with noticeably fewer dots, indicating a reduction in trips.
- The decrease in trip starts and ends is significant, reflecting the impact of the pandemic on commuting patterns, likely due to remote work policies and reduced social and economic activities.
The animations below provide a visual representation of how significantly the pandemic affected commuter rail traffic, with a stark reduction in the number of trips reflecting changes in work and travel behaviors.